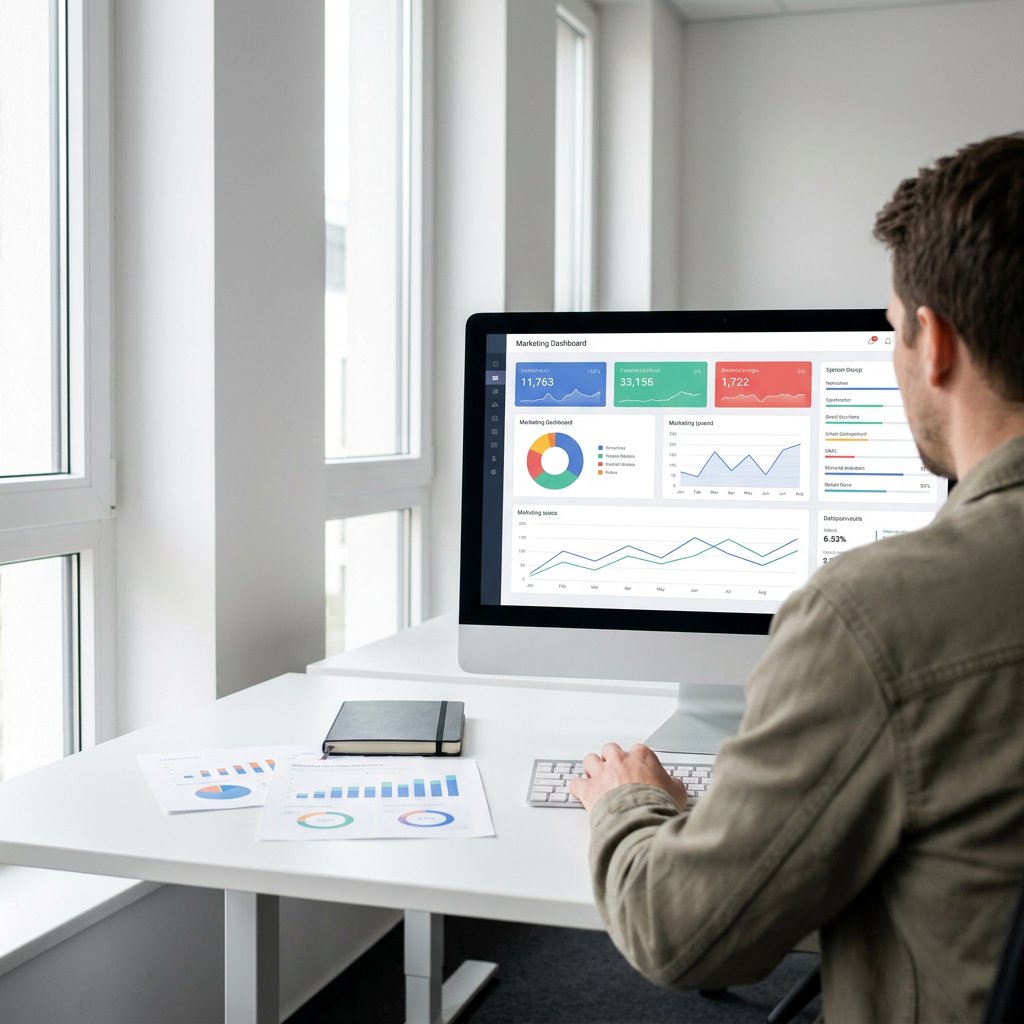
A strong animated video is only truly valuable if you can demonstrate its impact. Measurement provides answers to questions such as: who watches, how long do people stay engaged, where do they drop off, and what are the results? By clearly defining goals and KPIs in advance, configuring events and UTMs, and analyzing the results, you can steer specifically towards increased watch duration, engagement, and conversion. In this guide, you will find the practical approach and measurement methods that work for animated videos on your website, in email, and on social media. Also read about the impact on social media: impact of animations on social media.

Start with one main goal per video. Consider: increasing brand awareness, explaining products, or generating leads. Make the goal specific and measurable: for example, a 40 percent viewing rate on the landing page, or a 2 percent click-through rate to a demo request from your explainer animation. Link a timeframe and target audience to the goal so you can compare results fairly.
Link the right KPIs to each goal. For awareness, focus on reach and watch time; for engagement, on interactions; and for conversion, on click-through and conversion rates. Measure both quantitatively (numbers) and qualitatively (feedback) so that you understand why something works. See also measuring the effectiveness of animations for KPIs and measurement methods.
| Goal | Key KPI | How to measure | Tools |
|---|---|---|---|
| Awareness | Views, unique viewers, watch rate | Video views per channel, drop-off points | YouTube/Vimeo analytics, LinkedIn/TikTok stats |
| Engagement | CTR, comments, shares, repeat views | Clicks on CTA, social interactions | GA4 events, social analytics |
| Consideration | Page engagement, scroll depth, session duration | Heatmaps, click and scroll tracking | Hotjar/Clarity, GA4 |
| Conversion | Leads, demo requests, purchase rate | Event and conversion tracking with UTMs | GA4, tag manager, CRM |
Make complex information clear, understandable, and convincing
Combine multiple methods for a complete picture.
Numbers tell you what happens, user testing reveals why. Have 5-8 people from your target audience perform a task, such as “understand the core of the product in 60 seconds and click through to the price.” Observe where they hesitate, which scenes are unclear, and whether the voice-over pace and tone match expectations. Insights from the psychology behind animation and customer engagement help you link the right triggers to engagement metrics.
Ask follow-up questions: what was the main message, which call-to-action would you take now, and why or why not? Combine this with a quick 5-second test for the thumbnail and title: does someone immediately understand what the video is about? Qualitative insights often yield the greatest gains: a clearer opening message, a visual cue on a complex screen, or moving the CTA to the moment with the highest retention.
Analyze by channel and segment. Compare, for example, new visitors vs. returning visitors, mobile vs. desktop, and campaigns with different approaches. Pay attention to retention curves: sharp drops within 3-5 seconds often indicate a weak hook or slow start. An upward curve may point to rewatching a crucial scene—potentially the right moment for your CTA.
Work with comparable periods and a sufficient sample size. Use statistical significance in A/B testing, but be pragmatic: if variant B consistently has a 20 percent higher watch rate and a 15 percent higher CTR over several weeks, then choosing is logical. Record findings in a simple experiment log so you learn about themes, length, and style that work for your target audience. If you also want to include the effects on organic traffic and rankings, check out animation and SEO.
Address the biggest friction points first. Speed up the intro, make the first 3 seconds visually stronger, add subtitles for silent autoplay, and bring the CTA into view earlier if retention drops after 45 seconds. Test shorter versions for social media and a longer, more substantive version on the landing page. Reuse winning scenes in ads and email to maximize the return on proven strong moments.

Is your question not listed? Feel free to ask.
Ask your questionDefine a goal, link KPIs, set up event and UTM tracking, and analyze watch time, engagement, and conversion per channel. Combine quantitative data with user testing for context and improve your video iteratively.
This varies per funnel. Awareness: impressions and watch rate. Engagement: CTR, comments, and shares. Conversion: leads or purchases. Also look at retention curves to identify drop-off points.
Let the length follow from the goal. On social media, 6-30 seconds often works, while on a product page, 45-90 seconds works. Measure retention and test variants: the best length is the version with the highest view rate and desired conversion.
Only in context. Views are defined differently by platform and can be distorted by autoplay. Always look at watch duration, retention, and what a view yields in terms of clicks or conversions.
Would you like to have an animation video made with measurable results, or brainstorm about your measurement plan? We are happy to help with the storyboard, message, and how best to track success for your channels.

Whether it concerns an ambition, product, process, technology, or idea: we make visible what makes it special and translate it into imagery that is clear, convincing, and impossible to ignore.