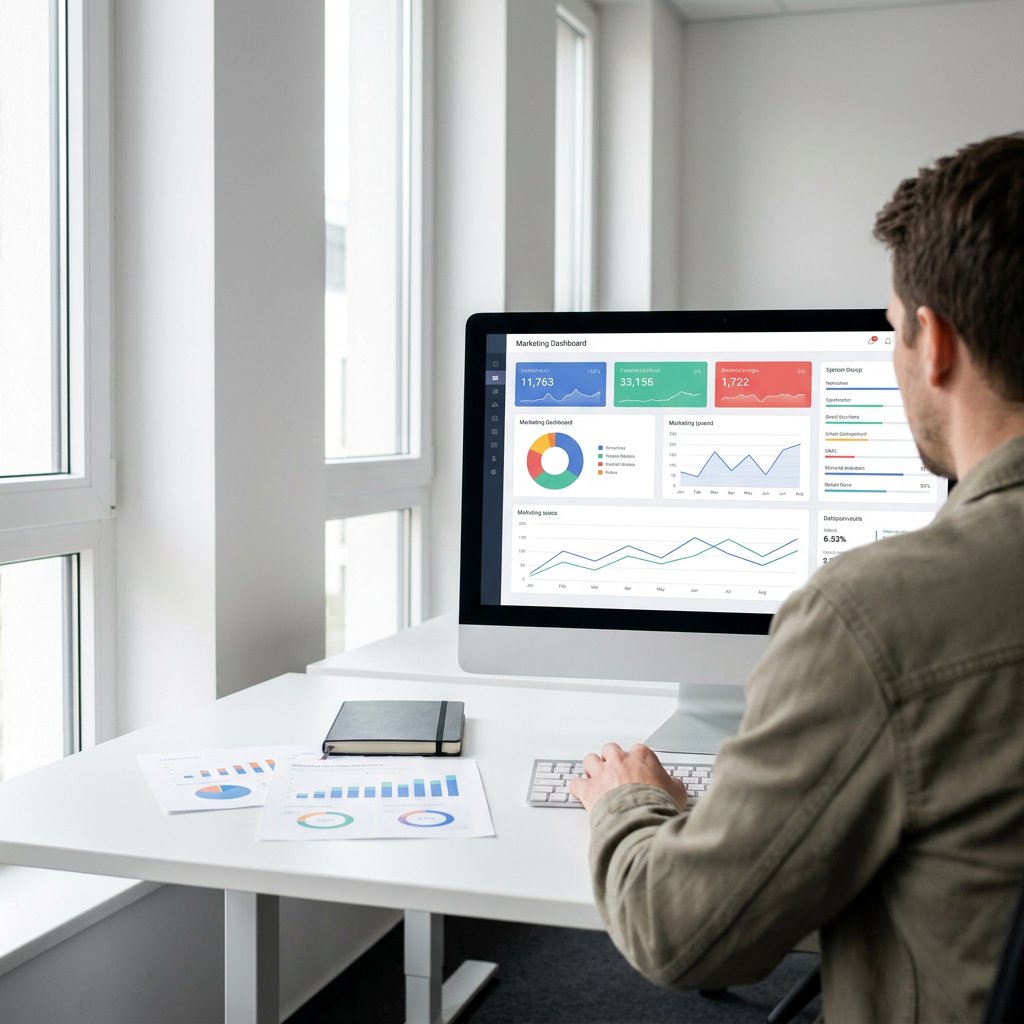
Infographic animation is an animation style in which facts, figures, and processes come to life with icons, graphs, and typography. Instead of a static infographic, you use movement, rhythm, and audio to make information sink in faster, be remembered better, and make it more engaging for channels such as websites, social media, and presentations.
An infographic animation video combines data visualization with motion design. Think of icons that transform into one another, bar charts that build up, and arrows that show a process step by step. The power lies in the structure: you present information in a measured way, making complex subject matter understandable without overwhelming viewers. Many infographic animations fall under the category of motion graphics animation.
Whereas a static infographic shows everything in a single image, animation lets you control the storyline. This can be done in 2D animation with clean lines and flat design, or in 3D animation when depth and product visualization are important. Whiteboard animation can also incorporate infographic elements, for example, if you are looking for a hand-drawn, educational style. Unsure which style to choose? Read: What is motion graphics?
Key building blocks include a clear text hierarchy, consistent iconography, color coding for categories, and a pace that aligns with your target audience. Short voiceovers or captions increase accessibility. Additionally, you can cut the animation into microcontent for social media or make it interactive on the website with clickable steps.
You use infographic animation when you want to clearly convey data, processes, or timelines and hold attention. It is ideal for pitches, onboarding, annual figures, product features, and internal communication.
Practical use cases include customer journeys, step-by-step plans, manuals, timelines, KPI updates, and data-driven campaigns. Do you already have a strong static infographic? Then animating is often the fastest route to increased reach and retention. For inspiration and proof: view the animation portfolio.
Do you want to optimize your efforts in campaigns? Read Animations for online marketing: best practices.
Make complex information clear, understandable, and convincing
Both styles explain, but they do so in a different way. The comparison below will help you choose.
| Aspect | Infographic animation | Character animation |
|---|---|---|
| Goal | Clarifying facts, figures, and processes | Story and emotion surrounding a person or brand |
| Form | Icons, graphs, typography, data visualization | Characters, facial expressions, scenes, storytelling |
| Strong in | Structure, overview, pace, scannability | Identification, brand personality, narrative |
| When to choose | Reports, onboarding, product features, KPIs | Employer branding, brand story, service situations |
| Shape variants | 2D, 3D, whiteboard, interactive | 2D or 3D with animated characters |

Is your question not listed? Feel free to ask.
Ask your questionAn infographic is a visual representation of information using elements such as icons, text, and charts. Goal: to be understood and remembered quickly. An infographic animation adds movement and audio for extra clarity and attention.
Interactive infographics respond to user input, for example via clicking, hovering, or filtering. In video, this can be done via chapters and links; on the web, via animations that dynamically display data or steps.
That is a simplified explanation with short sentences, clear pictograms, and one message per shot. You avoid jargon, use recognizable examples, and choose a calm pace so that children follow the information step by step.
Do you want to know if an infographic style suits your 2D or 3D explainer animation , or have an infographic created ? At Animation Agency , we seamlessly integrate data visualization into custom animations for high-tech, healthcare, finance, and retail. Contact us to discuss your case.
Do you want to know if an infographic style suits your 2D or 3D explainer animation , or have an infographic created ? At Animation Agency , we seamlessly integrate data visualization into custom animations for high-tech, healthcare, finance, and retail. Contact us to discuss your case.

Whether it concerns an ambition, product, process, technology, or idea: we make visible what makes it special and translate it into imagery that is clear, convincing, and impossible to ignore.